Case Study
77% Revenue Increase for a Pensacola Laundromat
We took this client from $14,700 per month to $26,000 per month in six months. That is 1.77x in revenue with an 11.3x return on their SEO investment.
The Approach
Our Hands-Off Approach
The client did not have to lift a finger. We did all the research and work necessary to get their site and Google Business Profile ranked higher.
We first met weekly to discuss changes and explain everything going on, then moved to bi-weekly, and now monthly meetings. Here is everything that went into this campaign:
- Full On-Page Audit
- Full Technical Audit
- Google Business Profile Audit
- HTML Tags Audit
- Keyword Research
- Added Advanced Schema to All Pages
- Fully Filled Out Google Business Profile
- Full Audit of Images, Image Tags and Alt Text
- Added Service-Specific Pages
- Added Blog Content to Boost Relevance
- Achieved Multiple Citations
The Results
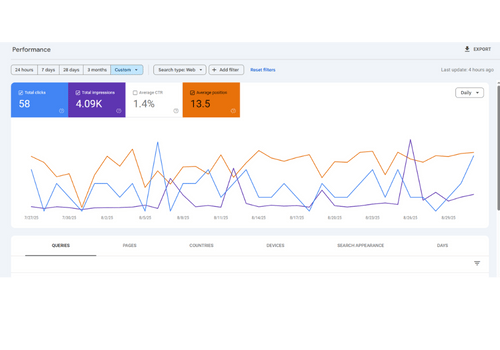
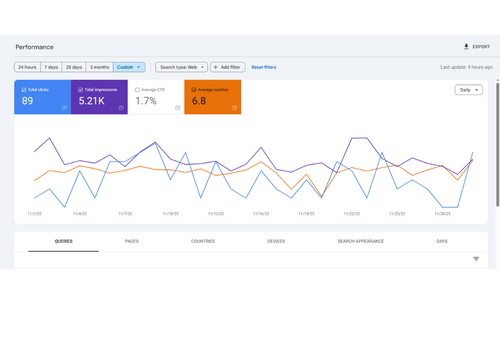
Google Search Ranking Improvements
Clicks in August
Clicks in November
Click Increase
In August their average position in Google search was at 13.4. What does that mean? It means they were appearing around the 3rd to 4th position on the second page of Google.
Here is the problem with that. When is the last time you went to the second page of Google for anything? Exactly.
Now they are at an average position of 6.8 as of November 2025. That puts them on the first page where customers are actually clicking.
The Numbers
Annual Revenue Projections
To put the monthly results in annual perspective:
Before, based on $14,700 times 12 months.
After, based on $26,000 times 12 months.
Disclaimer: These results are not guaranteed for every campaign; your results may vary. These results are not typical and depend on various factors such as market conditions, implementation, and business specifics.
The 11.3x figure is based on the annual projected difference (after minus before) divided by the annual cost of the service provided ($1,000 per month). Projections assume consistent monthly revenue without adjustments for seasonality or external factors.
We started working with this company in August 2025. The revenue figures shown are based on projections of current revenue as of November 2025 multiplied by 12. Projections assume consistent monthly revenue without adjustments for seasonality or external factors. The information shared here is for example purposes and not a guarantee of a rate of return or a specific result.
Ready for Your Success Story?
We have limited capacity to ensure every client receives dedicated, hands-on attention. Call or send a message and get a straight answer on what it will take to rank higher on Google.
Get In Touch